The Scenario Dashboard serves as the central management layer for your organization's creative operations. Designed for admins and project owners, it integrates real-time consumption data with granular audit logs to ensure total transparency across all production tracks.
1. Analytics & Consumption Insights
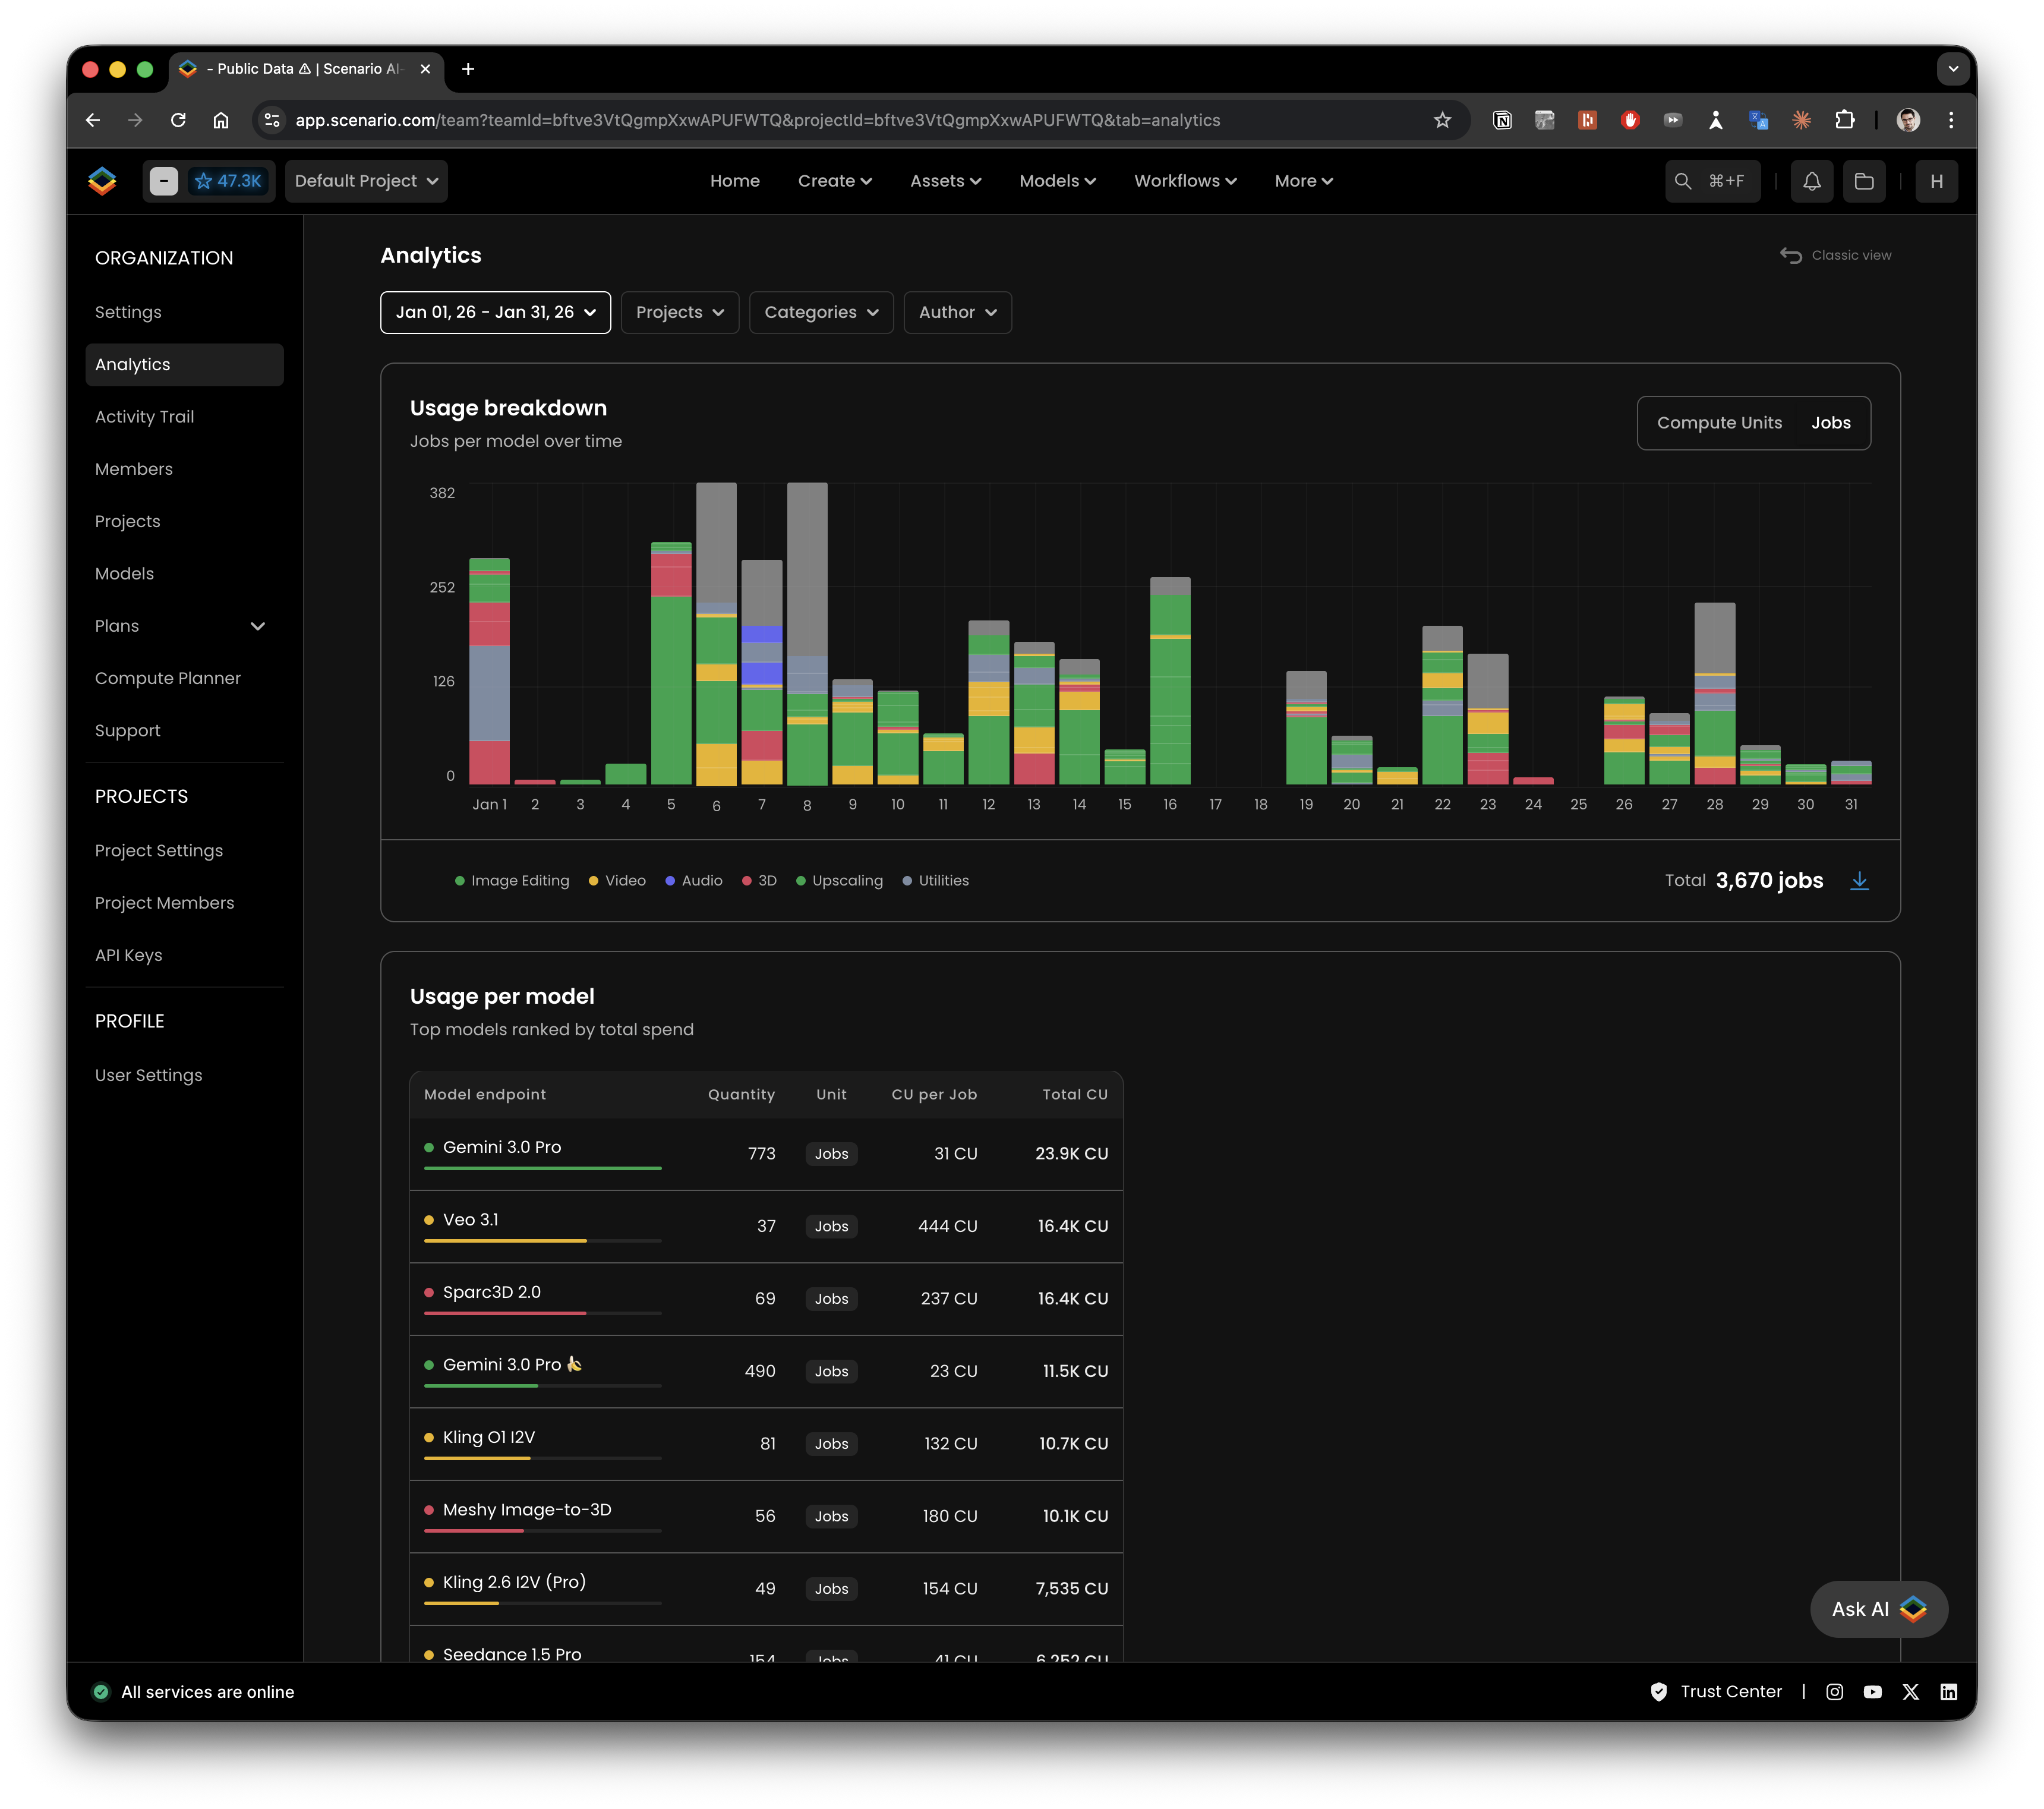
The Analytics tab provides high-level visibility into resource allocation, allowing you to monitor spend at the organization and project levels.
Usage Breakdown: Track production costs over time by toggling between Compute Units (CU) to monitor spend and Jobs to monitor volume.
Model Performance Rankings: Analyze which specific model endpoints, such as Gemini 3.0 Pro or Kling V3, are driving usage. This view includes quantity of jobs, CU per job, and total cost.
Activity Heatmap: Identify peak production days and usage patterns through a color-coded yearly activity map.
Top Consumers: View a ranked list of the most active users within your workspace to manage individual contributions.
Data Portability: Every chart and table can be exported to CSV via the download icon for use in external business intelligence tools.
Advanced Filtering Suite
Date Range: Quickly filter by presets like the last 24 hours, 30 days, or a custom timeframe via the interactive calendar.
Projects: Isolate data to specific team workspaces or view aggregate activity across the entire organization.
Categories: Drill down into specific creative outputs, including Image Editing, Video, Audio, 3D, Upscaling, and Utilities.
Author: Track spend and actions by individual team members or specific API keys for total accountability .
2. Activity Trail: The Visual Audit Log
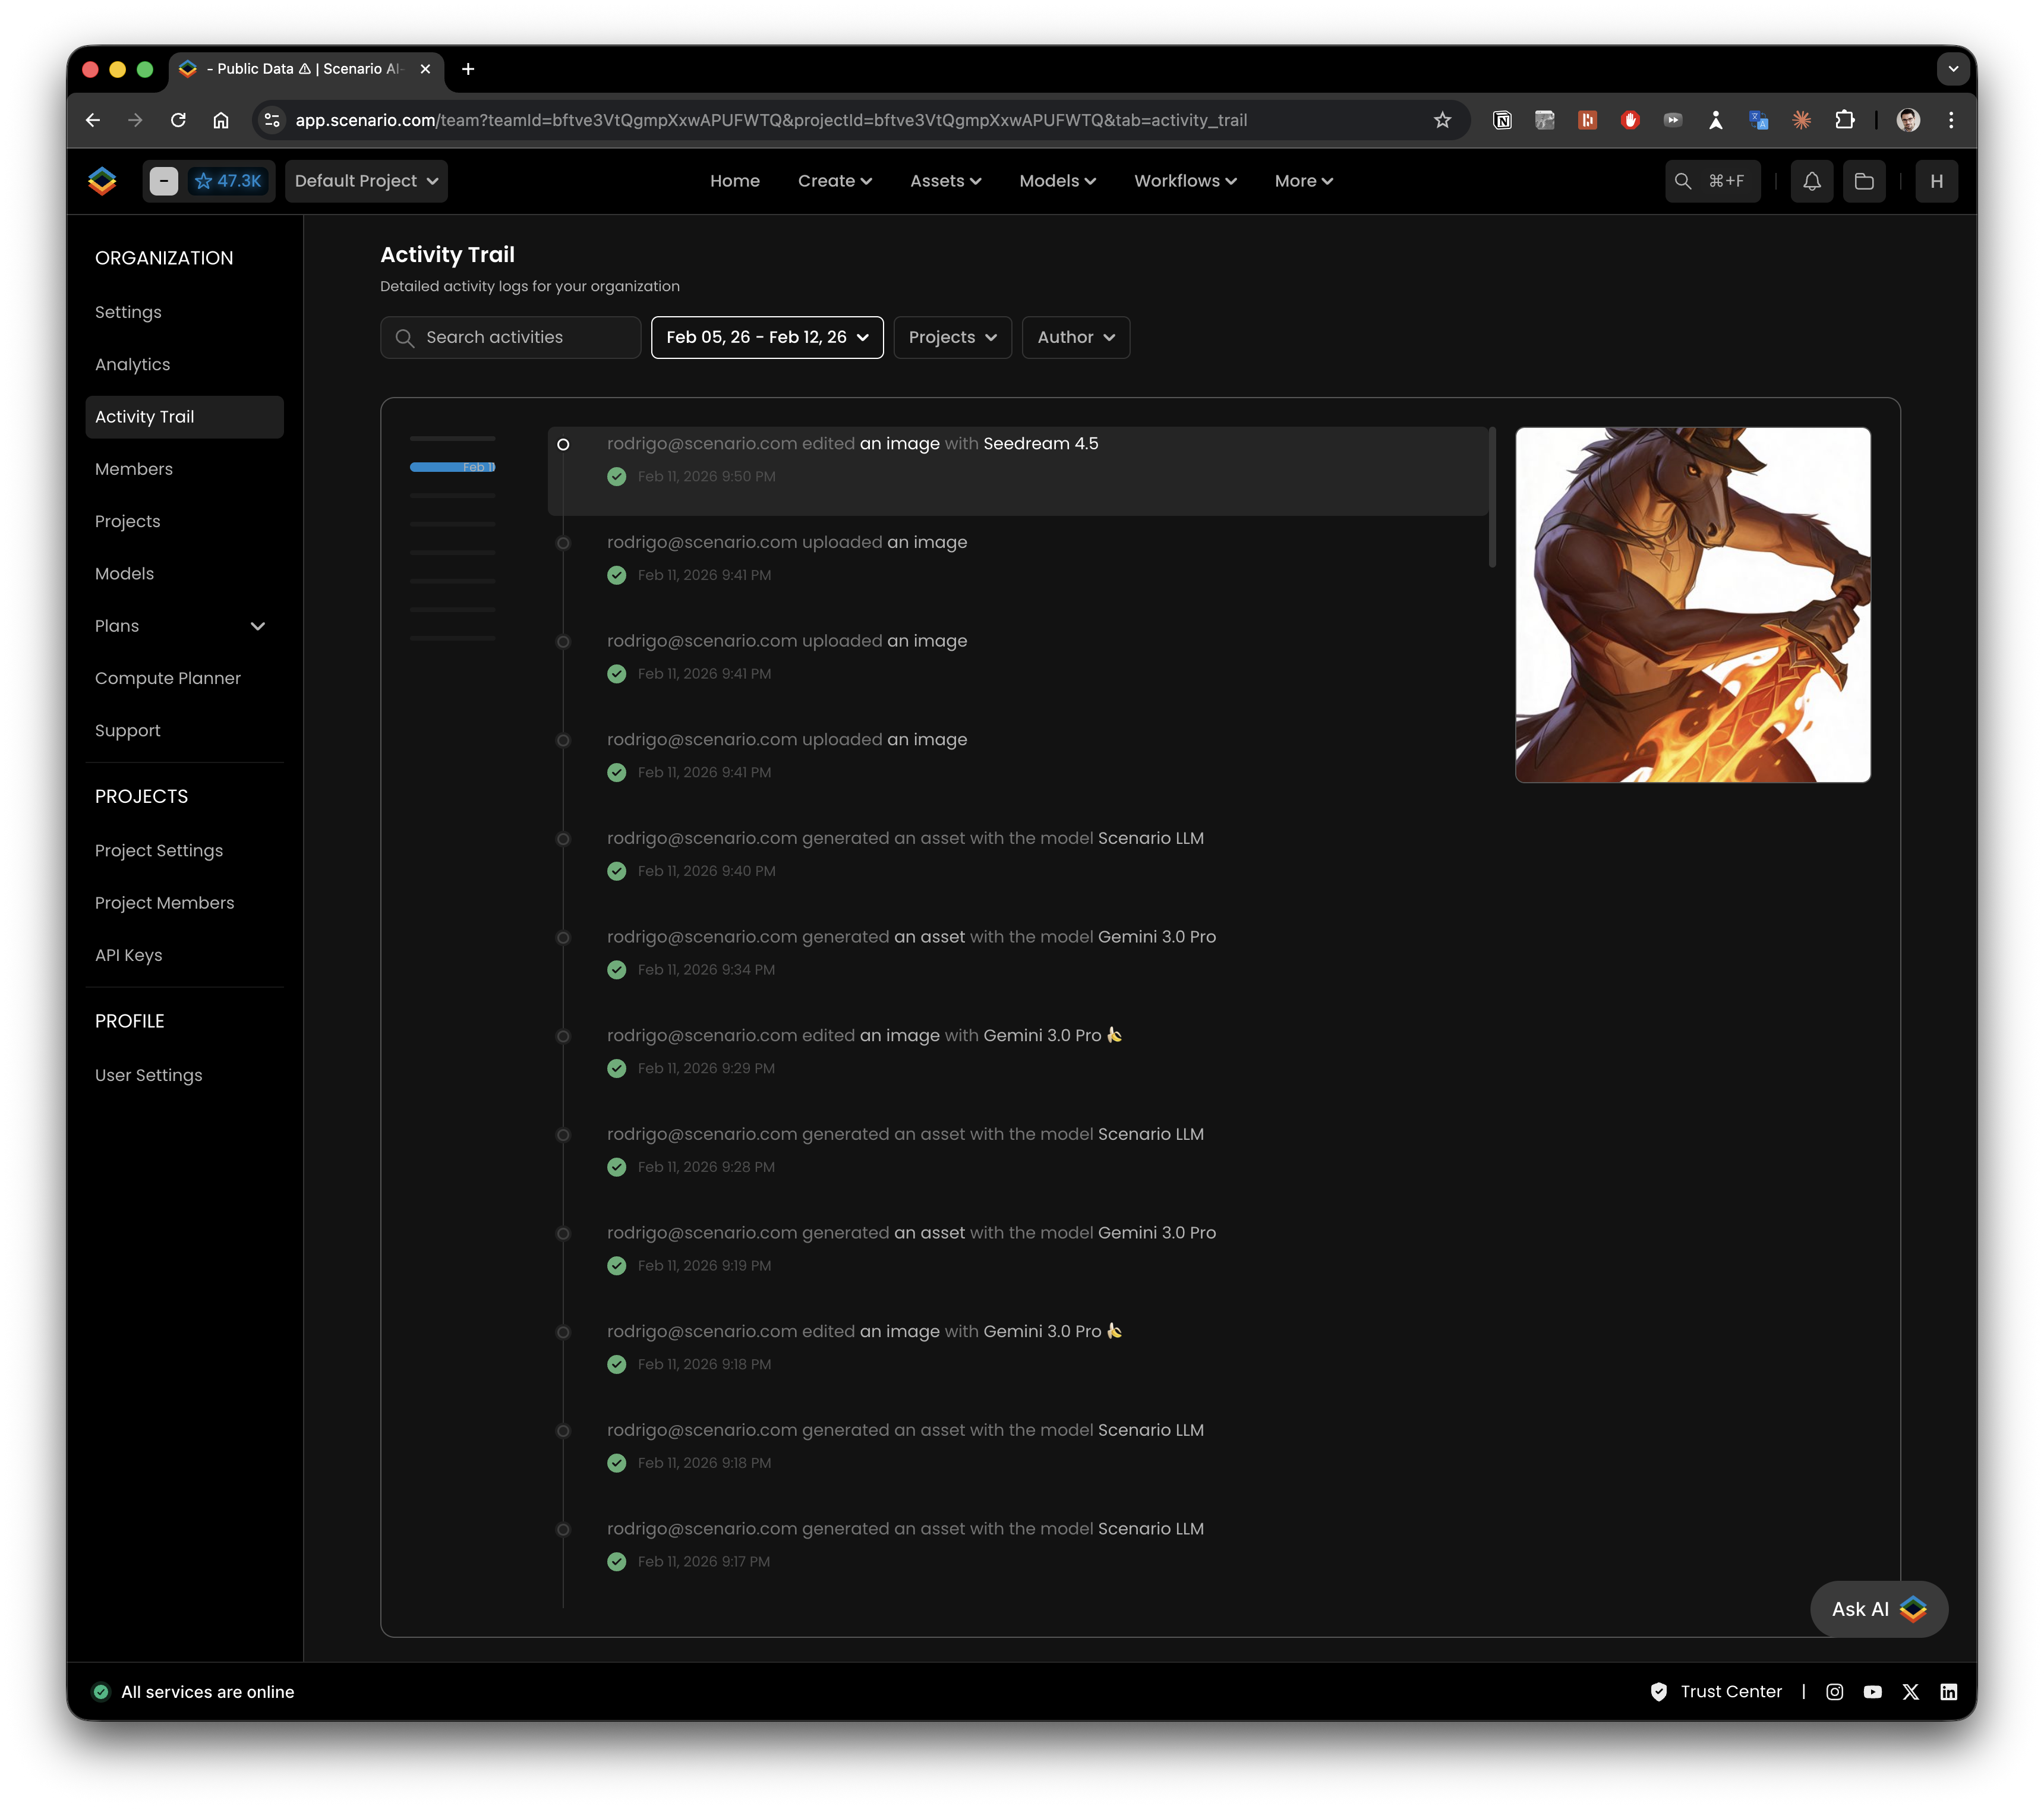
The Activity Trail provides a professional-grade, searchable log of every creative action taken within the organization.
Action Tracking: Every generation, image edit, and model change is recorded with a precise timestamp and user attribution.
Visual Context: To simplify auditing, logs include asset preview thumbnails, allowing admins to verify creative output without leaving the dashboard.
Advanced Search: Locate specific events instantly using keywords (e.g., "delete" or "edit") or filter logs by date, project, and author.
3. Resource Planning & Forecasting
Integrated tools help admins stay ahead of production demands and prevent workflow interruptions.
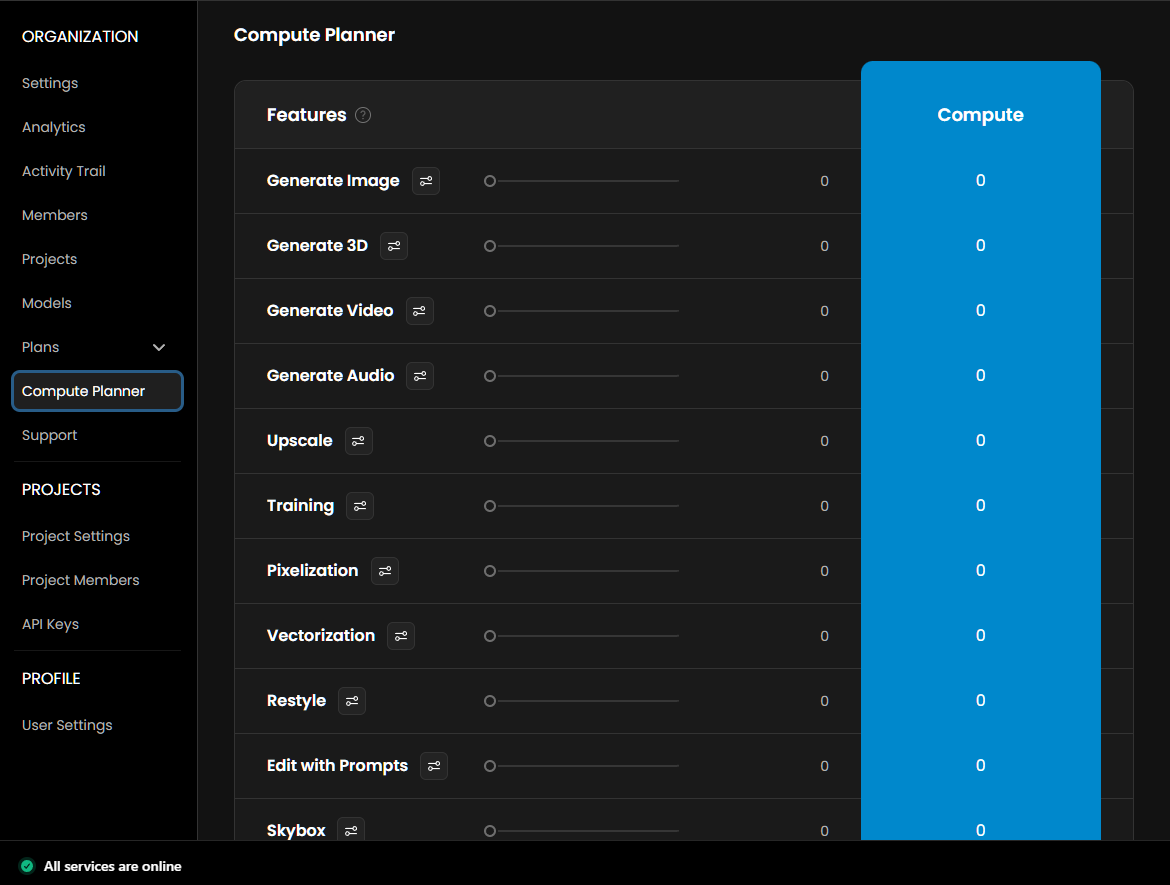
Compute Planner: Use task-specific sliders to estimate the credits needed for future projects across all capabilities, including Image, Video, 3D, and Audio generation.
Quota Management: Monitor your current monthly quota (e.g., Enterprise tier with 60,000 CU) and configure Auto-Refill settings to ensure a constant credit supply.
4. Technical Summary: Managing AI at Scale
The dashboard bridges the gap between creative production and infrastructure management through two technical pillars:
Full API Coverage: 100% of the metrics and logs visible in the web app can be queried programmatically and ingested into internal SIEM or BI frameworks.
Integrated Governance: While specific seat management and model toggles are handled in their respective sidebar modules, the Dashboard serves as the visual confirmation point for how role-based permissions and governance settings affect overall resource deployment.
5. FAQs
Can I export dashboard data?
Yes, CSV exports are available for enterprise users upon request. For API access, contact your Customer Success Manager.
Why don’t I see the Dashboard?
Dashboard access is limited to organization and project admins. Contact your admin if you need access.
What’s the difference between CU and Jobs?
Compute Units reflect credit usage. Jobs count actions like generations or trainings.
How often is data updated?
All metrics and activity logs update in real time or near real time.
6. Support
For historical data exports, advanced analytics, or integrations, please contact the Scenario support team ([email protected]).
Was this helpful?