1. Overview
The Scenario Dashboard offers real-time visibility into how your organization is using the platform: tracking creative output, compute consumption, and user-level contributions. It’s designed to help organization and project admins monitor overall usage, analyze per-user and per-project activity, and surface top contributors.
While it supports flexible filtering and trend analysis, some additional metrics - like weekly active users, user-level export, or model usage rankings - are available on request or currently under development.
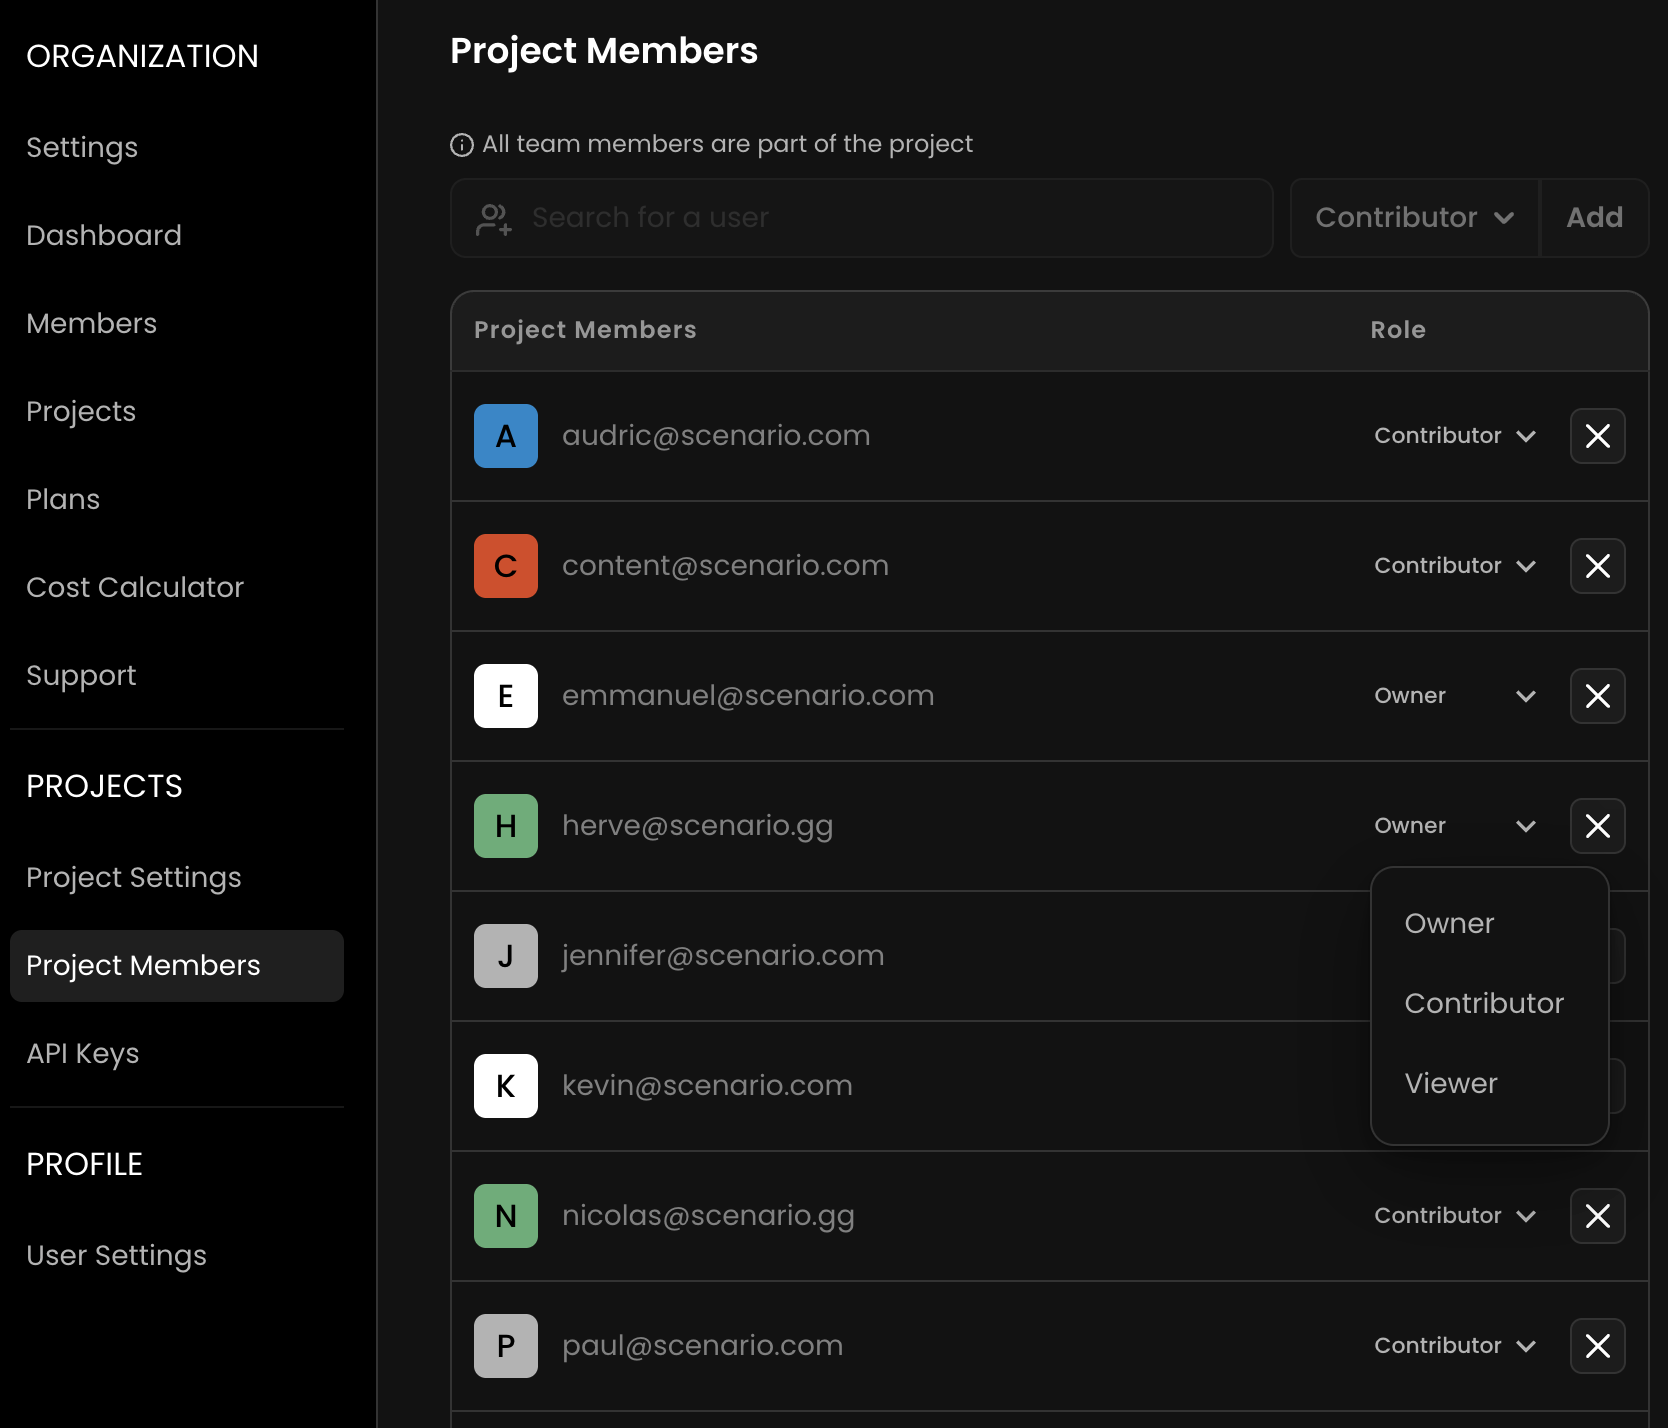
2. Access & Permissions
In Scenario, the organization is the account/company, and Projects are separate workspaces within it, each with its own members, permissions, or assets. Only Organization admins and Project admins can access the Dashboard.
Organization admins have visibility across all projects within the workspace
Project admins can view data only for the specific project(s) they manage.
Other users (contributors & viewers) do not have access. If the Dashboard isn’t visible to you, check your user role or contact your organization admin.
3. Core Metrics
The Dashboard tracks two core metrics:
Compute Units (CU) represent resource consumption. Every operation in Scenario (such as image generation, model training, video creation, or upscaling) consumes CU. This metric helps you monitor how credits are being spent.
Jobs represent individual creative actions. These include image and video generations, model trainings, background removals, enhancements, and more.
Together, CU and Jobs give you a view of how much work is being produced, plus the cost associated with it.
4. Using Filters
Leverage a range of filter to explore activity and and refine view the Dashboard
By Date
Start by selecting a time frame. The Dashboard offers quick options like “Today/Yesterday” or “This Month/Quarter” for fast access to common views. If you're looking at a specific campaign, event, or milestone, you can also define a custom date range to match your exact timeframe.
By Projects
Next, you can focus your analysis by selecting one or more projects - if you have access to them. Since each project is isolated in terms of content and membership, this lets you examine activity within a specific team or production track.
By Users
You can choose to view data for all users or filter by individual users to track contributions, highlight top performers, or review specific team member activity during the selected period.
By Job
Lastly, the “job” filter lets you isolate specific kinds of activity. Whether you're interested in image generations, model training, video creation, upscaling and much more - filtering by job type gives you a view of how different tools are being used.
Filters are designed to work together. For example, you can combine a custom date range with a specific project and job type to answer precise questions, like “which users in Project Beta consumed the most Compute Units for video generation last month”. Such level of control allows for granular, actionable insights across your organization.
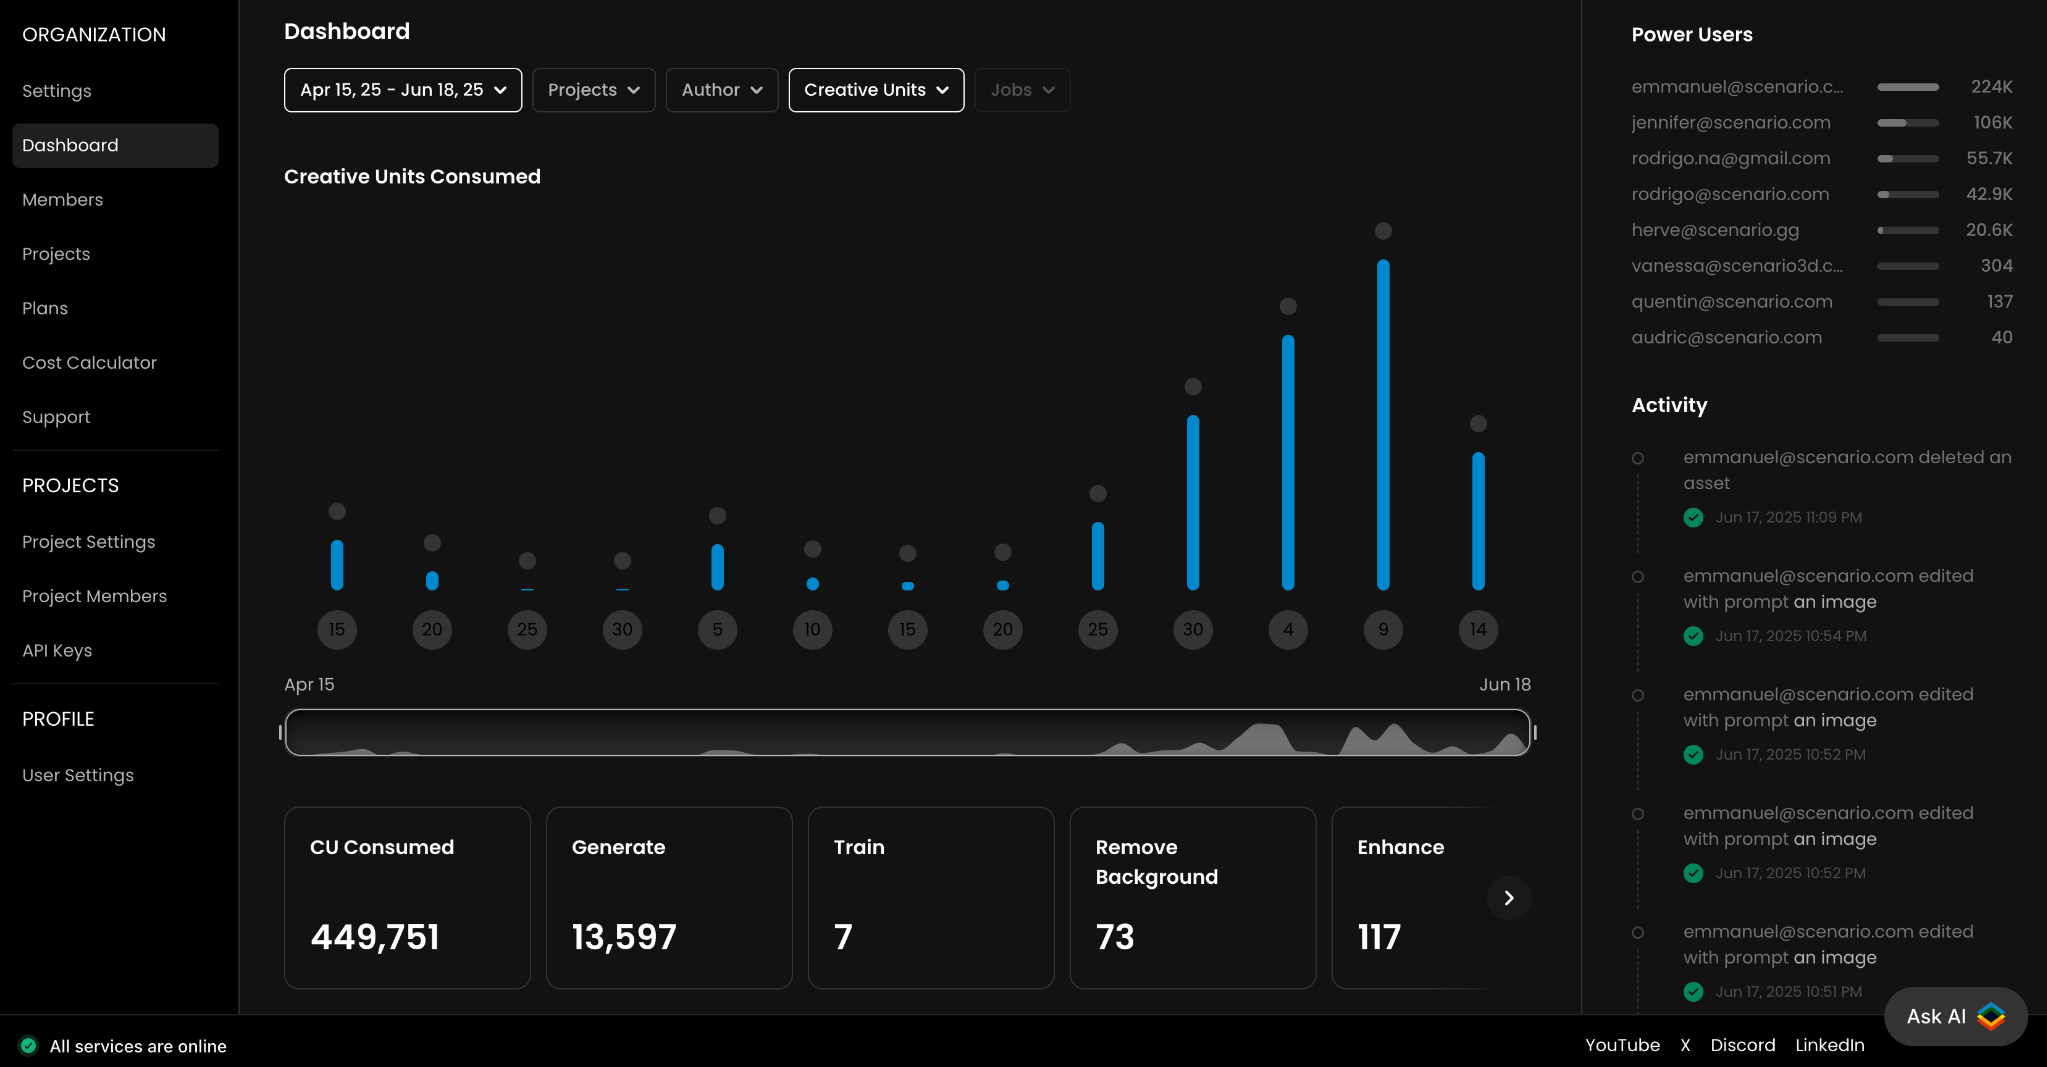
5. Main Graph and Totals
The central graph displays activity over time, based on the filters applied. You can switch between viewing Compute Units (CU) or Job counts. Hovering over the bars shows a breakdown, and the timeline slider below allows you to focus on a specific time window.
Below the graph, the totals panel summarizes key metrics for the selected filters. It begins with total CU consumed, followed by counts for image generations, trainings, background removals, upscaling, and other tracked job types.
6. “Power Users“ Panel
To the top right, the Power Users section highlights the top contributors based on Compute Units consumed. The list updates according to the filters you've applied (like date range, project, or job type) and ranks users from highest to lowest CU usage.
7. Activity Feed
The Activity Feed provides a real-time audit trail of all major actions within your workspace, by users. This includes generations, trainings, edits, asset deletions, and more. It can be filtered by project or user, making it useful for tracking specific activity, verifying actions, or conducting internal reviews.
8. FAQs
Can I export dashboard data?
Yes, CSV exports are available for enterprise users upon request. For API access, contact your Customer Success Manager.
Why don’t I see the Dashboard?
Dashboard access is limited to organization and project admins. Contact your admin if you need access.
What’s the difference between CU and Jobs?
Compute Units reflect credit usage. Jobs count actions like generations or trainings.
How often is data updated?
All metrics and activity logs update in real time or near real time.
9. Support
For historical data exports, advanced analytics, or integrations, please contact the Scenario support team ([email protected]).
Was this helpful?